Welcome to the Impact Report—the one time a year we believe in leaving a trace. This is our yearly portrait of progress, where we share the triumphs and challenges faced, the work still to be done, and everything we’ve learned in between. Whether it’s through the gear we make, the causes we support, or the voices we uplift, we’re making a lasting mark for the good of our planet, communities, and lives outside.
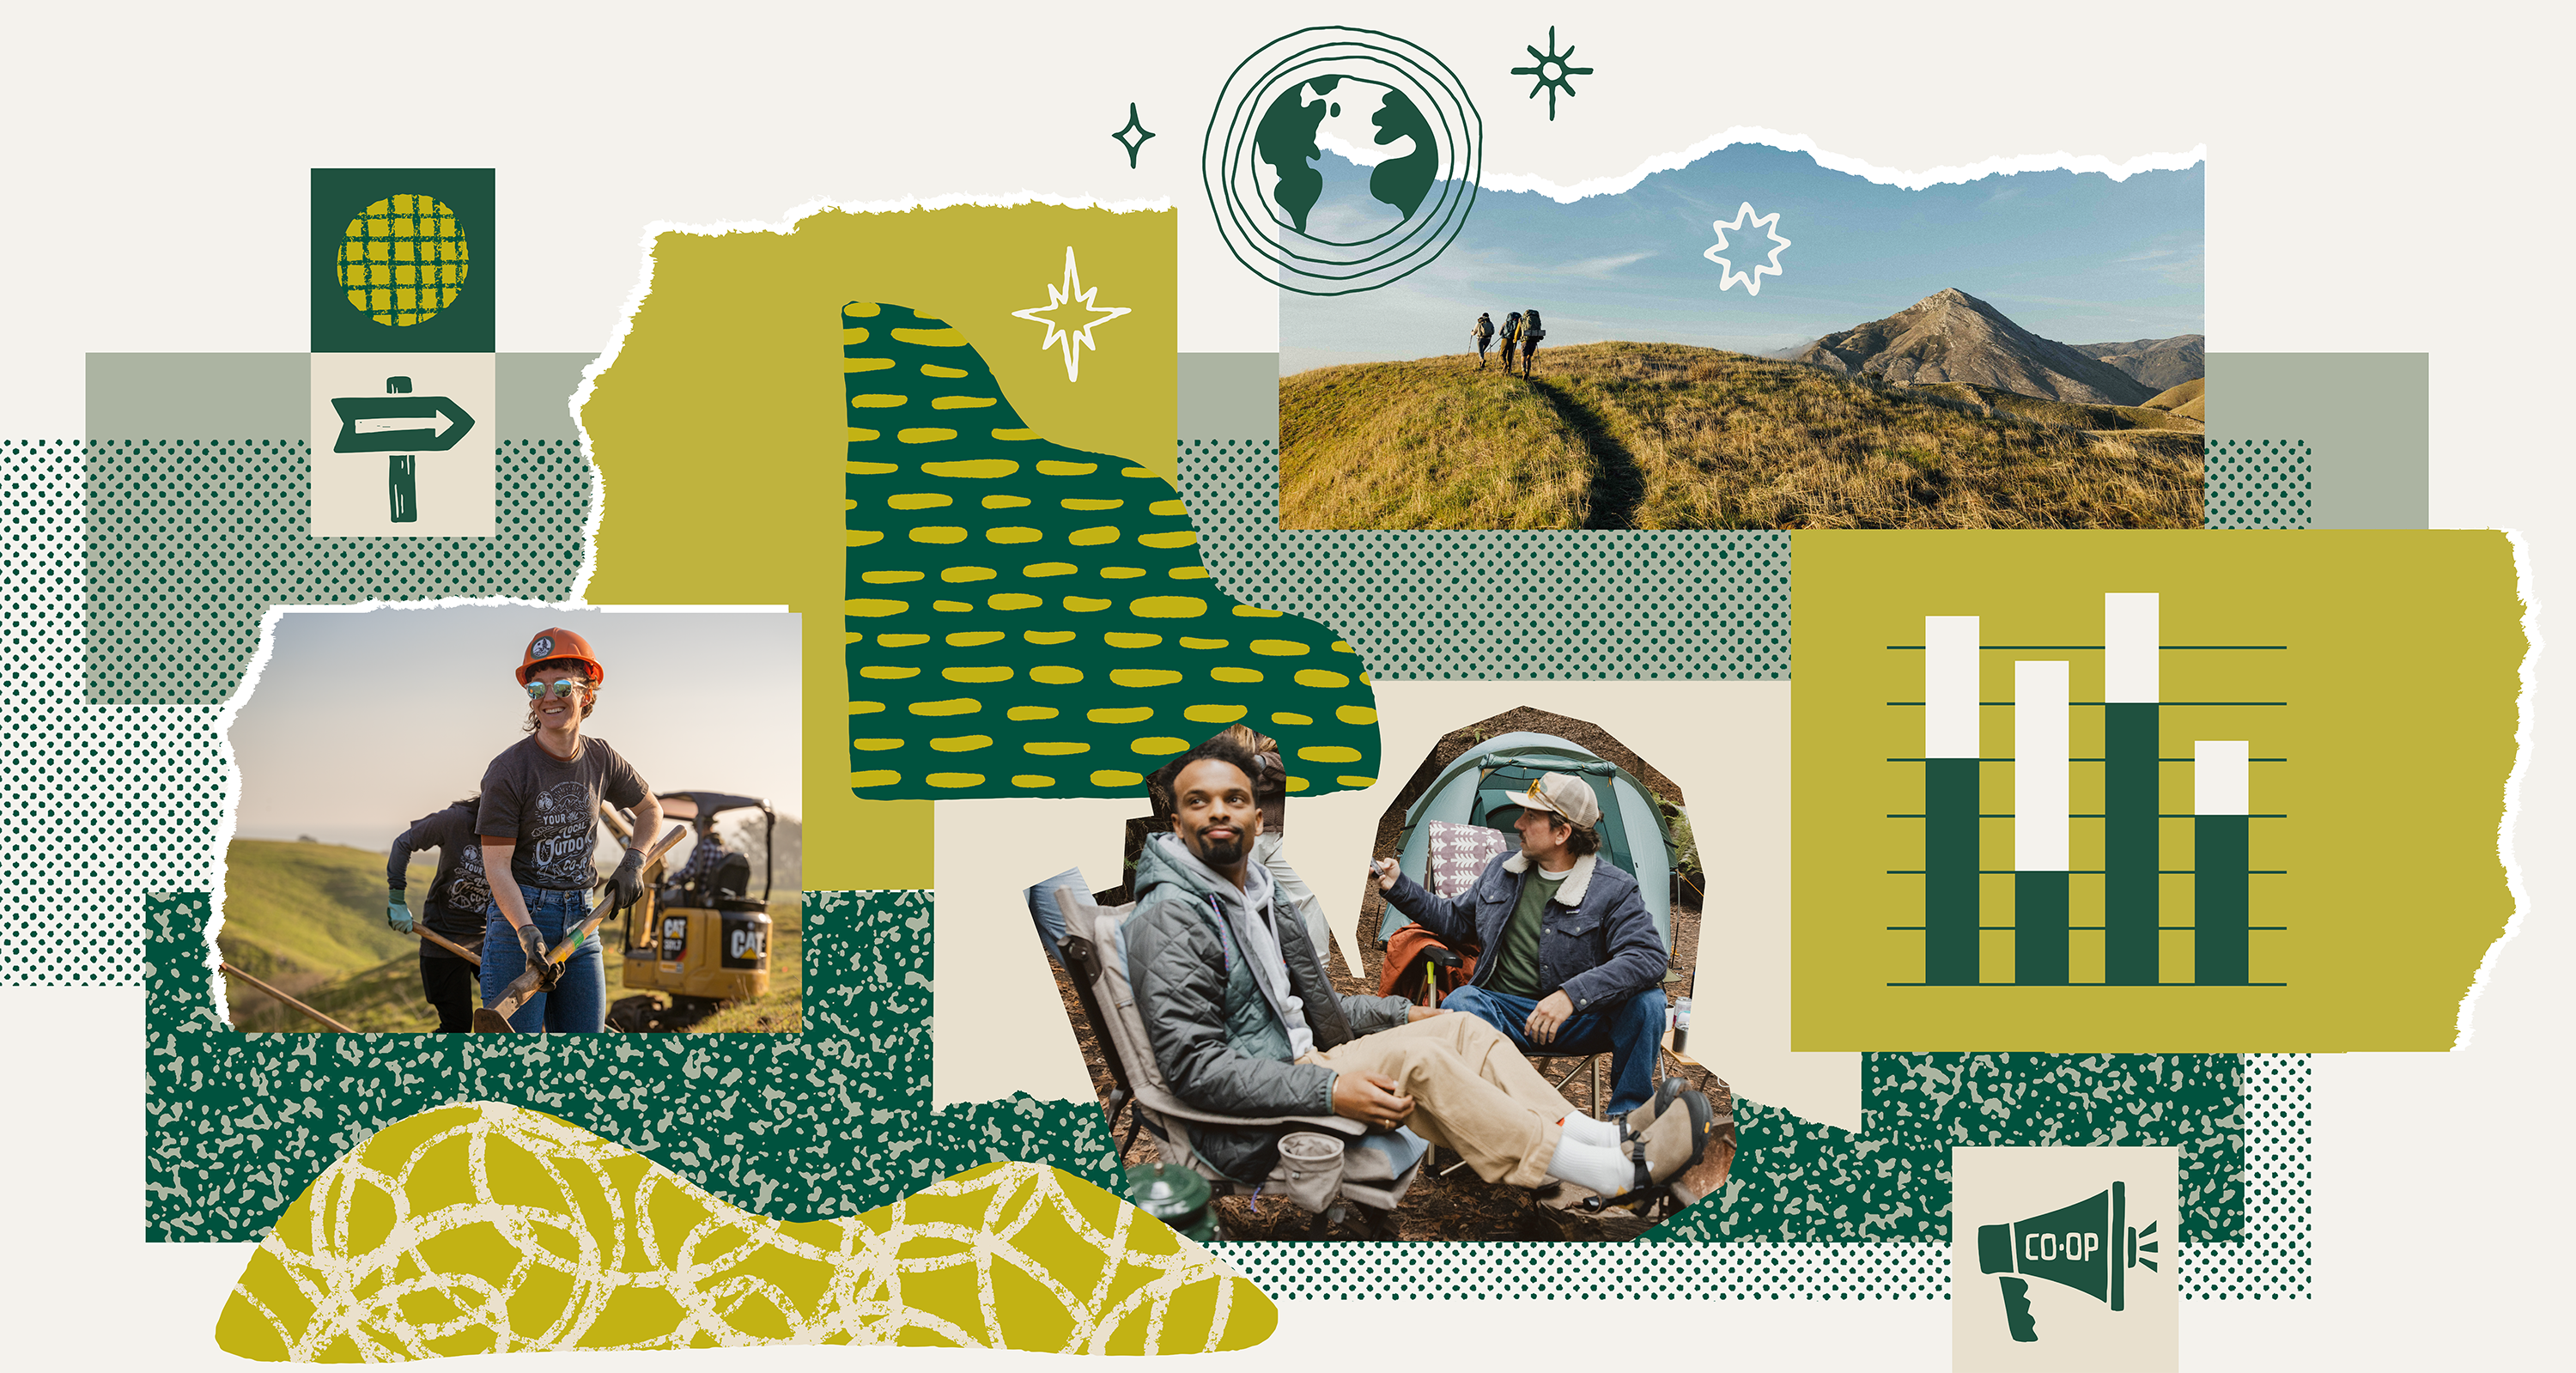
2025 by the numbers
12,478
employees
26+ million
members
$3.54 billion
in Co-op Sales
$121.9 million
for Employee Retirement & Incentives
~$12 million
invested in over 360 Nonprofit Partners by the REI Cooperative Action Fund
$202+ million
in Co-op Member Rewards
"This past year showed what’s possible when we stay grounded in our Peak 28 strategy and true to who we are." - Mary Beth Laughton, president and CEO of REI Co‑op
Read the letter from the CEOA HEALTHY PLANET
We’re on a journey to ensure the outdoors remains a place we can all enjoy for generations to come. In 2025, we continued to accelerate clean energy, invest in emerging technologies, and more—making our mark on the industry and world for the outdoors we love.
Read the full report
Trailblazing tech that turns waste into high-performance gear
Each year, the fashion industry produces 92 million tons of textile waste. The co-op is on a mission to break that cycle. In 2025, we signed a 3-year agreement with Ambercycle, a company turning waste textiles into high-performance materials. It’s part of our goal to build better gear with less waste—and share what we learn along the way. “We want to give these next-generation technologies a platform to grow, so that in the future they will be accessible for more and more brands,” says Ajay C., Director of Materials Innovation for REI Co-op Brands.
READ MOREACCESS TO NATURE
Whether through stewardship events or lobbying in D.C., the co-op uses our network of people who love the outdoors to ensure everyone has access to nature. This year, we sent a record number of messages, organized new coalitions, and so much more.
Read the full report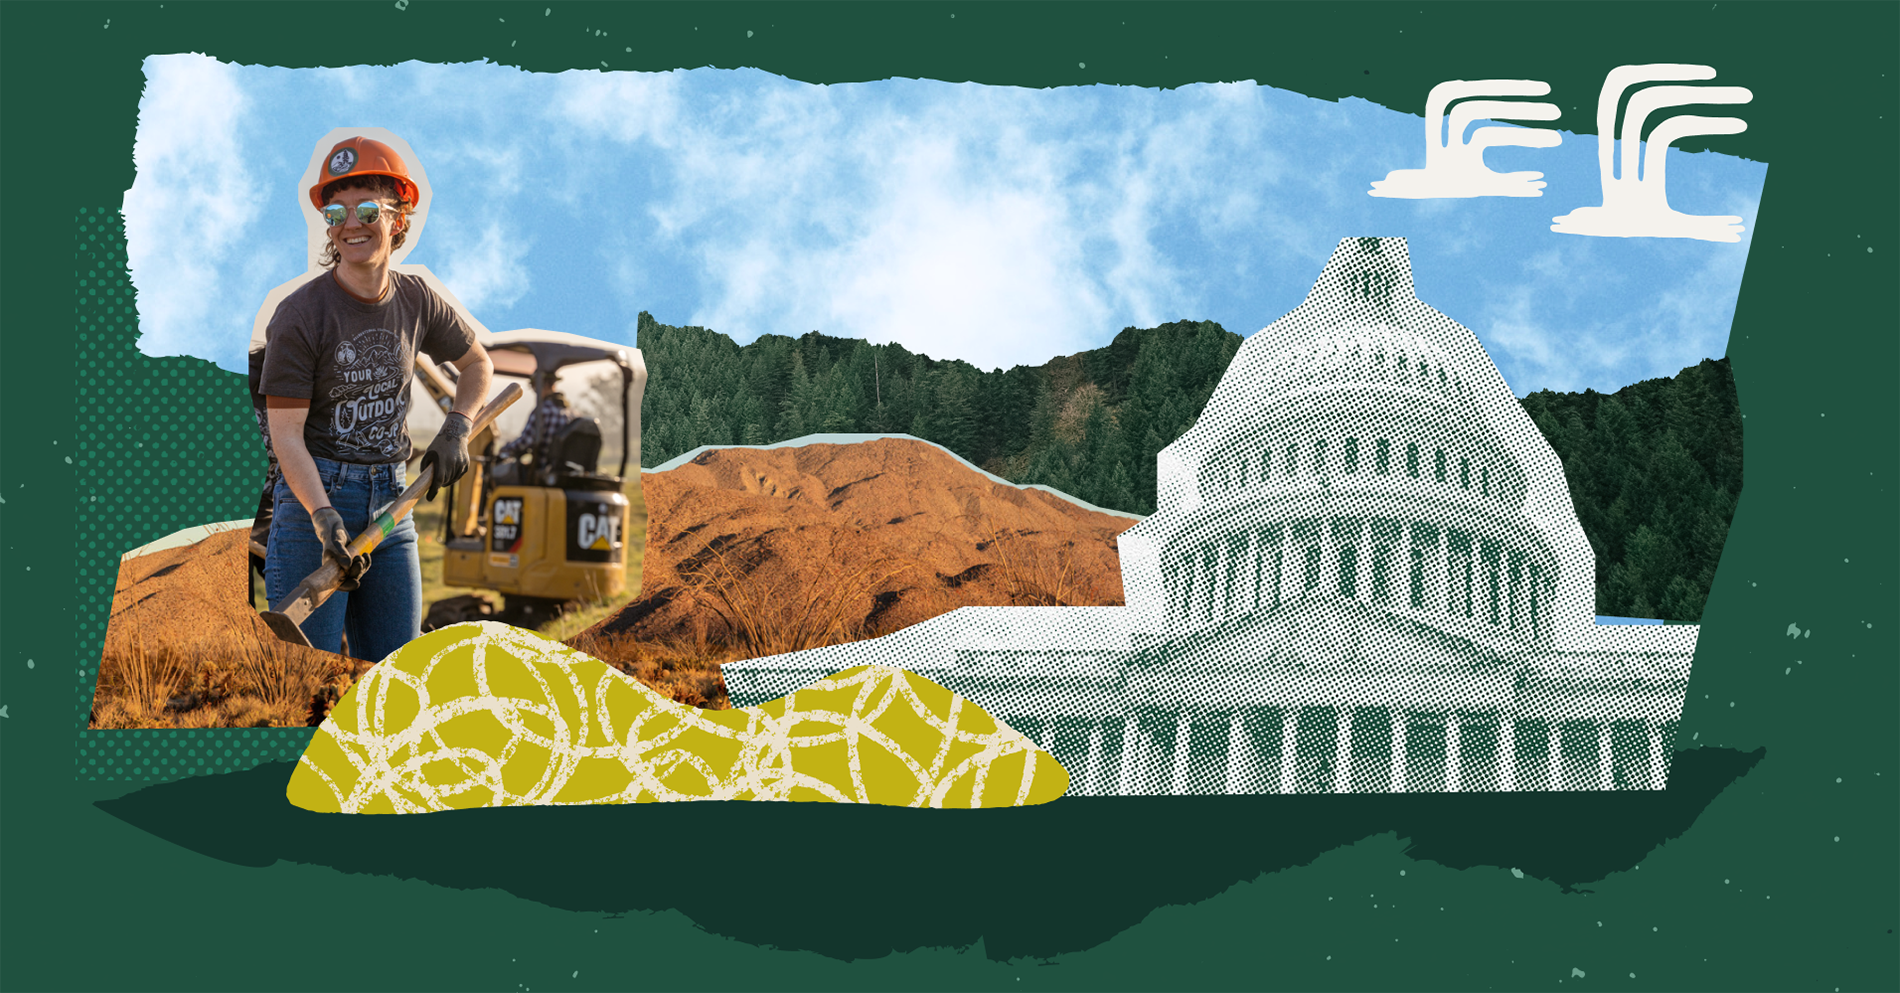
Standing up for our public lands
In 2025, threats to sell off America’s public lands reached new levels—but the outdoor community spoke up when it mattered most. To amplify those voices, the co-op “met with lawmakers in DC, state capitals and local venues, mobilized members, engaged folks in stores, and showed up on social—pulling every lever we have as a brand,” says Alicia H., Senior Manager of Community & Government Affairs. The result: 789,647 messages supporting the No Public Lands Sell-off initiative—from all 50 states, plus Puerto Rico and the U.S. Virgin Islands.
READ MOREAN INCLUSIVE OUTDOORS
From the gear we make to the spaces we create, the co-op is on a mission to make sure the outdoor industry and culture reflect the full spectrum of people’s experiences outside. In 2025, co-op employees, members and partners all came together for our mission.
Read the full report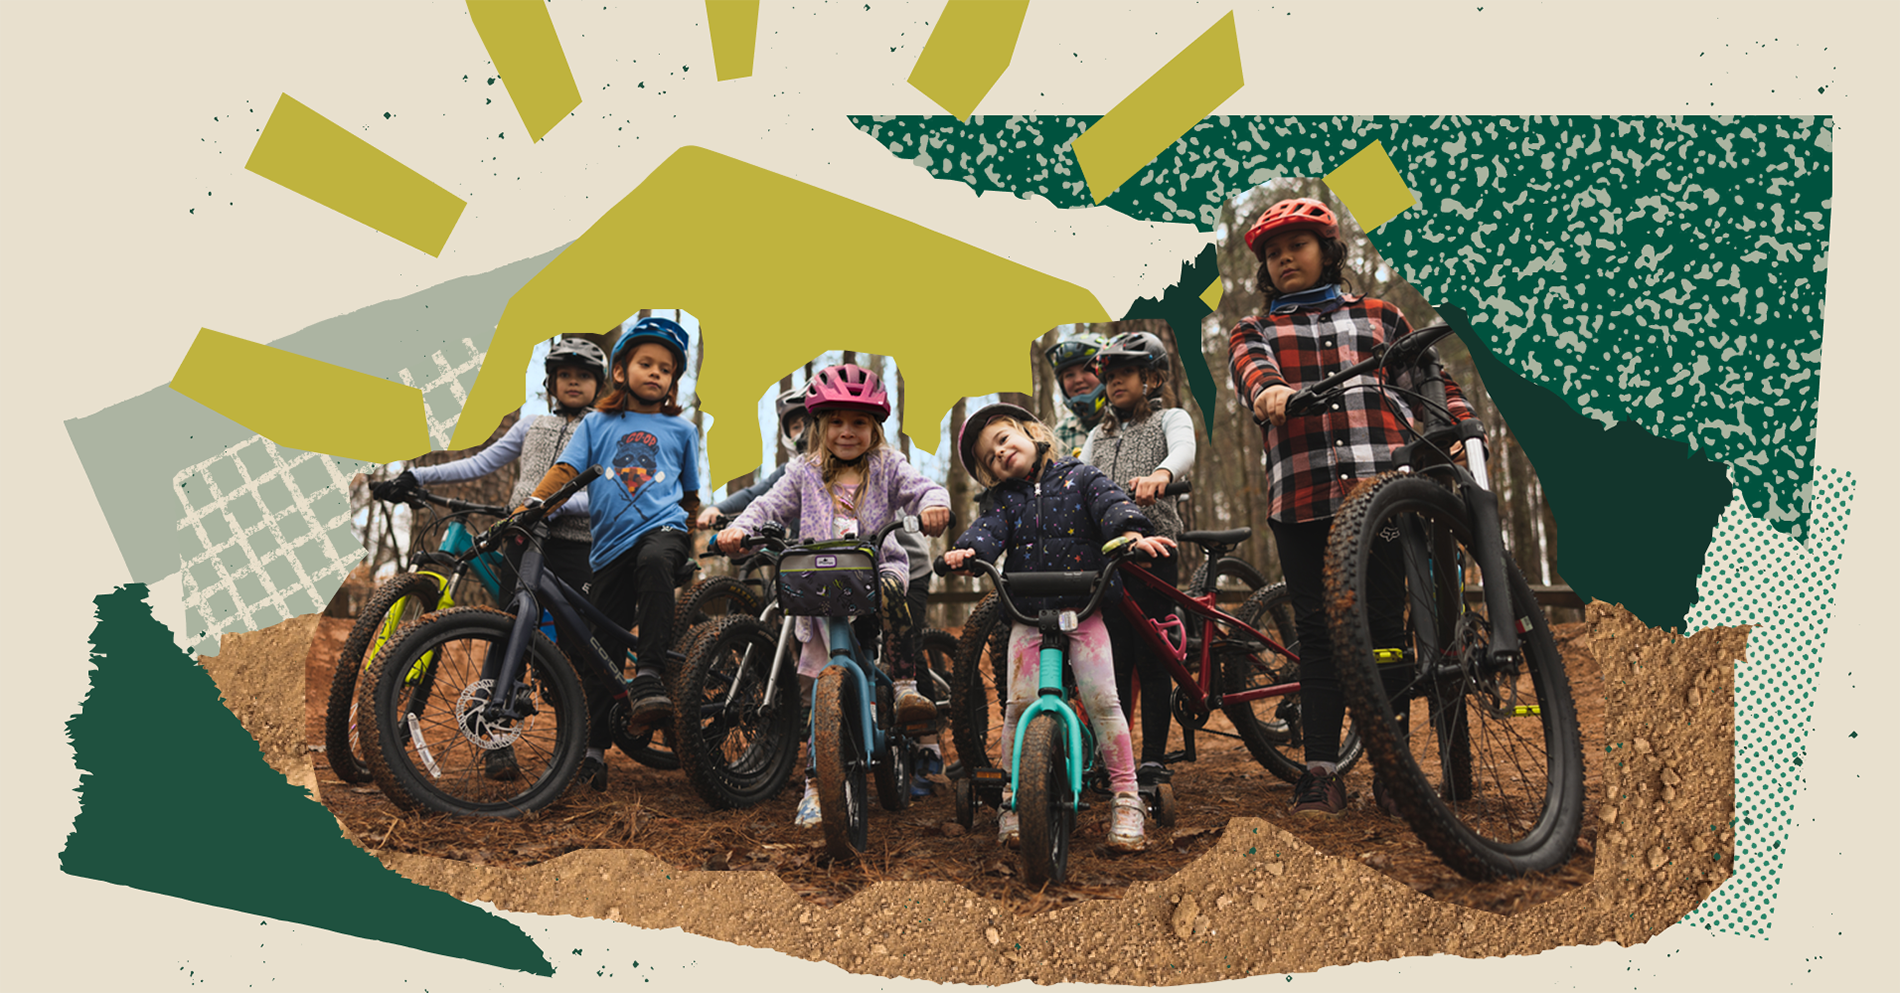
Data-driven design tailored to include the littlest adventurers
When it comes to fostering a love of the outdoors, the right piece of gear can make all the difference. But inherited assumptions embedded in gear design can cause friction and discomfort—like using adult-sized gear as the model for kids’ gear. In 2025, Co-op Cycles challenged this paradigm. “We asked, why not apply apparel data to things like cycles?” says Director of Product Strategy Nate B. Using in-depth sizing analysis and input from REI members, the team rebuilt kids’ Co-op Cycles from the ground up.
READ MORE
How We Measure Progress

ANTI-RACIST COMMITMENT
As one of the largest players in the outdoor industry, we recognize that to drive the change we want to see, we must start from within the co-op. We are committed to becoming a fully inclusive, anti-racist, multicultural organization, and this commitment guides our policies and practices.
LEARN MORE
IMPACT OBJECTIVES & KEY RESULTS
Our Impact objectives and key results (OKRs) allow REI to transparently track the co-op’s progress against clear, outcome-based measures that reflect the issues that matter most to our members and support REI’s commitment to expand outdoor access to all.
LEARN MORE
PRODUCT IMPACT STANDARDS
REI sets clear social, environmental and inclusion standards for ourselves and the brands we carry. Each year, we review REI’s Product Impact Standards and measure progress across our assortment. In 2025, over 830 brands shared updates on their performance, helping raise the bar for the outdoor community.
LEARN MORE